
This is the first of my posts for Netapp Filers monitoring. Main purpose here is to monitor operations per second on these Filers. As usual, we'll script for getting the values and then use RRD to stock values over a period of time and graph them !
For that, we'll use a perl script, which does an SNMP call on the Filer in order to get the values (disk usage, cpu usage, IOs, network IO; here operations per second are interesting us). In order to run this script, you must have, Perl, net-snmp-perl, perl-Config-IniFiles, and perl-Crypt-DES installed. Get the script check_netapp here !. I customized this script in order to read NetIN, NetOUT, OPS/sec and so on. If you need to add new SNMP entries in this script, get them from /vol0/etc/mib/traps.dat from your Netapp. You'll also need utils.pm from Nagios, get it on my site, here.
Once these files copied on your machine and libs installed, this is the crontab entry for our Bash script :
* * * * * cd /root/scripts/; /root/scripts/netapp1_ops_rrdAnd here is what netapp1_ops_rrd look like :
#!/bin/bash

check="/root/scripts/check_netapp"
args=" -H 192.168.xxx.xxx  "
stockage="/data/rrd"
rep_logs="/root/logs"
rep_img="/data/www/monitoring"
declare -ar durees='([0]="1" [1]="10" [2]="30" [3]="90"  )'


creation_rrd(){

   if [ ! -f $stockage/netapp1_ops.rrd ]
   then
           echo "rrdtool create  $stockage/netapp1_ops.rrd -s 60  \\" > /tmp/create.sh
           echo "DS:cifsops:COUNTER:180:U:U      \\" >> /tmp/create.sh
           echo "RRA:MAX:0.5:1:14400       \\" >> /tmp/create.sh
           echo "RRA:AVERAGE:0.5:30:960   \\" >> /tmp/create.sh
           echo "RRA:AVERAGE:0.5:180:480   \\" >> /tmp/create.sh
           echo "DS:nfsops:COUNTER:180:U:U      \\" >> /tmp/create.sh
           echo "RRA:MAX:0.5:1:14400       \\" >> /tmp/create.sh
           echo "RRA:AVERAGE:0.5:30:960   \\" >> /tmp/create.sh
           echo "RRA:AVERAGE:0.5:180:480   \\" >> /tmp/create.sh
           echo "DS:fcops:COUNTER:180:U:U      \\" >> /tmp/create.sh
           echo "RRA:MAX:0.5:1:14400       \\" >> /tmp/create.sh
           echo "RRA:AVERAGE:0.5:30:960   \\" >> /tmp/create.sh
           echo "RRA:AVERAGE:0.5:180:480   \\" >> /tmp/create.sh
   echo >> /tmp/create.sh
   . /tmp/create.sh
   rm -f /tmp/create.sh
   fi
}

maj_rrd(){
   commande="rrdtool update $stockage/netapp1_ops.rrd N"
   comm=$(echo $check$args" -v CIFSOPS")
   res=$($comm)
   cifsops=$(echo $res| awk '{print $6}' )
   comm=$(echo $check$args" -v NFSOPS")
   res=$($comm)
   nfsops=$(echo $res| awk '{print $6}' )
   comm=$(echo $check$args" -v FCOPS")
   res=$($comm)
   fcops=$(echo $res| awk '{print $6}' )
   commande=$commande":"$cifsops":"$nfsops":"$fcops
   #echo $commande
   $($commande)
}

creation_graph(){
   for i in ${durees[*]}
   do
        echo "rrdtool graph $rep_img/netapp1_ops_"$i".png                         \\" > /tmp/graph_netapp1_ops.sh
        echo "-s \"now -$i"" days\" -e now                                 \\" >> /tmp/graph_netapp1_ops.sh
        echo "--title=\"Operations par seconde sur Netapp1, les "$i" derniers jours\"     \\" >> /tmp/graph_netapp1_ops.sh
        echo "--vertical-label=\"OPS / sec \"                \\" >> /tmp/graph_netapp1_ops.sh
        echo "--imgformat=PNG                                          \\" >> /tmp/graph_netapp1_ops.sh
        echo "--color=BACK#CCCCCC                                          \\" >> /tmp/graph_netapp1_ops.sh
        echo "--color=CANVAS#343434                                          \\" >> /tmp/graph_netapp1_ops.sh
        echo "--color=SHADEB#9999CC                                          \\" >> /tmp/graph_netapp1_ops.sh
        echo "--width=600                                              \\" >> /tmp/graph_netapp1_ops.sh
        echo "--base=1000                                              \\" >> /tmp/graph_netapp1_ops.sh
        echo "--height=400                                             \\" >> /tmp/graph_netapp1_ops.sh
        echo "-E                                                      \\" >> /tmp/graph_netapp1_ops.sh
        echo "--lower-limit=0                                             \\" >> /tmp/graph_netapp1_ops.sh
        echo "DEF:cifsops=$stockage/netapp1_ops.rrd:cifsops:MAX                   \\" >> /tmp/graph_netapp1_ops.sh
        echo "AREA:cifsops#FE8A06:\" Operations CIFS par sec\"                    \\" >> /tmp/graph_netapp1_ops.sh
        echo "DEF:nfsops=$stockage/netapp1_ops.rrd:nfsops:MAX                   \\" >> /tmp/graph_netapp1_ops.sh
        echo "AREA:nfsops#06FE40:\" Operations NFS par sec\":STACK                    \\" >> /tmp/graph_netapp1_ops.sh
        echo "DEF:fcops=$stockage/netapp1_ops.rrd:fcops:MAX                   \\" >> /tmp/graph_netapp1_ops.sh
        echo "AREA:fcops#F7053E:\" Operations FC par sec\":STACK                    \\" >> /tmp/graph_netapp1_ops.sh
        . /tmp/graph_netapp1_ops.sh
        rm -f /tmp/graph_netapp1_ops.sh
   done
}

cd /root/scripts
creation_rrd
maj_rrd
creation_graph
As you can see, in RRD I decided to stock 3 RRA per value : 10 days with a precision of 1mn, 20 days with an average on 30 minutes and 60 days with an average on 3 hours. You can modify all that as you wish in the rrd create command !
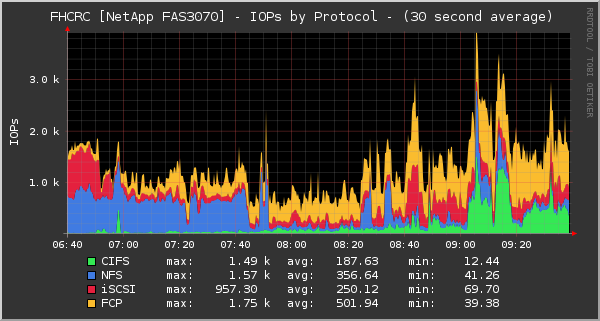
What is new comparing to the other RRDs I presented is that here we use an array of values (1, 10, 30, 90) in order to generate graphs for 1day, 10days, 30days, ... In that way we have an "MRTG-like" monitoring for our Netapp operations per second.
An other new thing is the values we get from SNMP : for CIFS for ex. we get TOTAL operations since the Filer has rebooted. This explains why we stock a "COUNTER" in RRD and not a GAUGE like usually !
We also use Areas into RRD graphs and stack them to have a nice graph like the one on RRD's site, here
As usual, refer to the post image in order to have a preview of the graph !
Have fun !


2 comments:
Nice work. There are some tricks to NetApp monitoring - they change metrics and oids from release to release of Data OnTap. (e.g. the oid for failed fans changes in the point release from 7.3.1 to 7.3.2. Don't ask me why.)
They dont expose all data to snmp, only API. (e.g. volume latency, or operations per volume).
They dont seem to grasp 64 bit counters (so if you have large volumes, you have to convert signed to unsigned integers to accurately track space usage.)
And they renumber volume instances frequently, especially if you have snap mirror running.
If you dont feel like dealing with all these issues yourself, and just want something you can point at a NetApp and say "Monitor everything automatically, and alert me if something is wrong", check out LogicMonitors NetApp Monitoring.
Or if you have questions on how to work around the above issues, feel free to email me.
Cheers
Thx. And you're right about OIDs changing, counters in 32 bits, etc.
For the moment we use home-made applications, as you can see, so we deal with that manually (reset counters when necessary, ...).
I had a look at LogicMonitor, seems to be very nice tools, especially for Netapps. If I need a "pro" solution for Filers monitoring, I'll definitively get in touch with you.
Soon I'll post monitoring tips for cluster computing, so it discussing this matter with you could be interesting.
Cheers !
Bogdan.
Post a Comment