Showing posts with label Monitoring. Show all posts

Dec 1, 2009

RRD Monitoring for Netapp [2] : Network in and out in KB/s


The second of my posts, concerning Netapp monitoring : this time we'll monitor Network IN and OUT. Refer to the previous article in order to get system dependencies, and software needed.

With the same perl script which reads SNMP entries, we'll get values for Netwok in and Network out for the Filer.
As for the operations per second, here we get TOTAL Network in and out. This explains why we have to stock it into a "COUNTER" and not a "GAUGE".

As usual, the crontab, every minute reads the value, updates the RRD and creates the graph :
* * * * * cd /root/scripts/; /root/scripts/netapp1_net_rrd
And now the script which does all that :
#!/bin/bash

check="/root/scripts/check_netapp"
args=" -H 192.168.xxx.xxx "
stockage="/data/rrd"
rep_logs="/root/logs"
rep_img="/data/www/monitoring"
declare -ar durees='([0]="1" [1]="10" [2]="30" [3]="90" )'


creation_rrd(){

if [ ! -f $stockage/netapp1_net.rrd ]
then
echo "rrdtool create $stockage/netapp1_net.rrd -s 60 \\" > /tmp/create.sh
echo "DS:netin:COUNTER:180:U:U \\" >> /tmp/create.sh
echo "RRA:MAX:0.5:1:14400 \\" >> /tmp/create.sh
echo "RRA:AVERAGE:0.5:30:960 \\" >> /tmp/create.sh
echo "RRA:AVERAGE:0.5:180:480 \\" >> /tmp/create.sh
echo "DS:netout:COUNTER:180:U:U \\" >> /tmp/create.sh
echo "RRA:MAX:0.5:1:14400 \\" >> /tmp/create.sh
echo "RRA:AVERAGE:0.5:30:960 \\" >> /tmp/create.sh
echo "RRA:AVERAGE:0.5:180:480 \\" >> /tmp/create.sh
echo >> /tmp/create.sh
. /tmp/create.sh
rm -f /tmp/create.sh
fi
}

maj_rrd(){
commande="rrdtool update $stockage/netapp1_net.rrd N"
comm=$(echo $check$args" -v NETIN")
res=$($comm)
cifsops=$(echo $res| awk '{print $7}' )
comm=$(echo $check$args" -v NETOUT")
res=$($comm)
nfsops=$(echo $res| awk '{print $7}' )
commande=$commande":"$cifsops":"$nfsops
#echo $commande
$($commande)
}

creation_graph(){
for i in ${durees[*]}
do
echo "rrdtool graph $rep_img/netapp1_net_"$i".png \\" > /tmp/graph_netapp1_net.sh
echo "-s \"now -"$i" days\" -e now \\" >> /tmp/graph_netapp1_net.sh
echo "--title=\"Entrees sorties reseau sur Netapp1, les "$i" derniers jours\" \\" >> /tmp/graph_netapp1_net.sh
echo "--vertical-label=\"KOctets / sec \" \\" >> /tmp/graph_netapp1_net.sh
echo "--imgformat=PNG \\" >> /tmp/graph_netapp1_net.sh
echo "--color=BACK#CCCCCC \\" >> /tmp/graph_netapp1_net.sh
echo "--color=CANVAS#343434 \\" >> /tmp/graph_netapp1_net.sh
echo "--color=SHADEB#9999CC \\" >> /tmp/graph_netapp1_net.sh
echo "--width=600 \\" >> /tmp/graph_netapp1_net.sh
echo "--base=1000 \\" >> /tmp/graph_netapp1_net.sh
echo "--height=400 \\" >> /tmp/graph_netapp1_net.sh
echo "--interlaced \\" >> /tmp/graph_netapp1_net.sh
echo "--lower-limit=0 \\" >> /tmp/graph_netapp1_net.sh
echo "DEF:netin=$stockage/netapp1_net.rrd:netin:MAX \\" >> /tmp/graph_netapp1_net.sh
echo "AREA:netin#FE8A06:\" Flux entrant reseau\" \\" >> /tmp/graph_netapp1_net.sh
echo "DEF:netout=$stockage/netapp1_net.rrd:netout:MAX \\" >> /tmp/graph_netapp1_net.sh
echo "LINE1:netout#06FE40:\" Flux sortant reseau\" \\" >> /tmp/graph_netapp1_net.sh
. /tmp/graph_netapp1_net.sh
rm -f /tmp/graph_netapp1_net.sh
done
}

cd /root/scripts
creation_rrd
maj_rrd
creation_graph


Have fun !

RRD Monitoring for Netapp [1] : Operations per second


This is the first of my posts for Netapp Filers monitoring. Main purpose here is to monitor operations per second on these Filers. As usual, we'll script for getting the values and then use RRD to stock values over a period of time and graph them !

For that, we'll use a perl script, which does an SNMP call on the Filer in order to get the values (disk usage, cpu usage, IOs, network IO; here operations per second are interesting us). In order to run this script, you must have, Perl, net-snmp-perl, perl-Config-IniFiles, and perl-Crypt-DES installed. Get the script check_netapp here !. I customized this script in order to read NetIN, NetOUT, OPS/sec and so on. If you need to add new SNMP entries in this script, get them from /vol0/etc/mib/traps.dat from your Netapp. You'll also need utils.pm from Nagios, get it on my site, here.

Once these files copied on your machine and libs installed, this is the crontab entry for our Bash script :
* * * * * cd /root/scripts/; /root/scripts/netapp1_ops_rrd

And here is what netapp1_ops_rrd look like :
#!/bin/bash

check="/root/scripts/check_netapp"
args=" -H 192.168.xxx.xxx "
stockage="/data/rrd"
rep_logs="/root/logs"
rep_img="/data/www/monitoring"
declare -ar durees='([0]="1" [1]="10" [2]="30" [3]="90" )'


creation_rrd(){

if [ ! -f $stockage/netapp1_ops.rrd ]
then
echo "rrdtool create $stockage/netapp1_ops.rrd -s 60 \\" > /tmp/create.sh
echo "DS:cifsops:COUNTER:180:U:U \\" >> /tmp/create.sh
echo "RRA:MAX:0.5:1:14400 \\" >> /tmp/create.sh
echo "RRA:AVERAGE:0.5:30:960 \\" >> /tmp/create.sh
echo "RRA:AVERAGE:0.5:180:480 \\" >> /tmp/create.sh
echo "DS:nfsops:COUNTER:180:U:U \\" >> /tmp/create.sh
echo "RRA:MAX:0.5:1:14400 \\" >> /tmp/create.sh
echo "RRA:AVERAGE:0.5:30:960 \\" >> /tmp/create.sh
echo "RRA:AVERAGE:0.5:180:480 \\" >> /tmp/create.sh
echo "DS:fcops:COUNTER:180:U:U \\" >> /tmp/create.sh
echo "RRA:MAX:0.5:1:14400 \\" >> /tmp/create.sh
echo "RRA:AVERAGE:0.5:30:960 \\" >> /tmp/create.sh
echo "RRA:AVERAGE:0.5:180:480 \\" >> /tmp/create.sh
echo >> /tmp/create.sh
. /tmp/create.sh
rm -f /tmp/create.sh
fi
}

maj_rrd(){
commande="rrdtool update $stockage/netapp1_ops.rrd N"
comm=$(echo $check$args" -v CIFSOPS")
res=$($comm)
cifsops=$(echo $res| awk '{print $6}' )
comm=$(echo $check$args" -v NFSOPS")
res=$($comm)
nfsops=$(echo $res| awk '{print $6}' )
comm=$(echo $check$args" -v FCOPS")
res=$($comm)
fcops=$(echo $res| awk '{print $6}' )
commande=$commande":"$cifsops":"$nfsops":"$fcops
#echo $commande
$($commande)
}

creation_graph(){
for i in ${durees[*]}
do
echo "rrdtool graph $rep_img/netapp1_ops_"$i".png \\" > /tmp/graph_netapp1_ops.sh
echo "-s \"now -$i"" days\" -e now \\" >> /tmp/graph_netapp1_ops.sh
echo "--title=\"Operations par seconde sur Netapp1, les "$i" derniers jours\" \\" >> /tmp/graph_netapp1_ops.sh
echo "--vertical-label=\"OPS / sec \" \\" >> /tmp/graph_netapp1_ops.sh
echo "--imgformat=PNG \\" >> /tmp/graph_netapp1_ops.sh
echo "--color=BACK#CCCCCC \\" >> /tmp/graph_netapp1_ops.sh
echo "--color=CANVAS#343434 \\" >> /tmp/graph_netapp1_ops.sh
echo "--color=SHADEB#9999CC \\" >> /tmp/graph_netapp1_ops.sh
echo "--width=600 \\" >> /tmp/graph_netapp1_ops.sh
echo "--base=1000 \\" >> /tmp/graph_netapp1_ops.sh
echo "--height=400 \\" >> /tmp/graph_netapp1_ops.sh
echo "-E \\" >> /tmp/graph_netapp1_ops.sh
echo "--lower-limit=0 \\" >> /tmp/graph_netapp1_ops.sh
echo "DEF:cifsops=$stockage/netapp1_ops.rrd:cifsops:MAX \\" >> /tmp/graph_netapp1_ops.sh
echo "AREA:cifsops#FE8A06:\" Operations CIFS par sec\" \\" >> /tmp/graph_netapp1_ops.sh
echo "DEF:nfsops=$stockage/netapp1_ops.rrd:nfsops:MAX \\" >> /tmp/graph_netapp1_ops.sh
echo "AREA:nfsops#06FE40:\" Operations NFS par sec\":STACK \\" >> /tmp/graph_netapp1_ops.sh
echo "DEF:fcops=$stockage/netapp1_ops.rrd:fcops:MAX \\" >> /tmp/graph_netapp1_ops.sh
echo "AREA:fcops#F7053E:\" Operations FC par sec\":STACK \\" >> /tmp/graph_netapp1_ops.sh
. /tmp/graph_netapp1_ops.sh
rm -f /tmp/graph_netapp1_ops.sh
done
}

cd /root/scripts
creation_rrd
maj_rrd
creation_graph


As you can see, in RRD I decided to stock 3 RRA per value : 10 days with a precision of 1mn, 20 days with an average on 30 minutes and 60 days with an average on 3 hours. You can modify all that as you wish in the rrd create command !
What is new comparing to the other RRDs I presented is that here we use an array of values (1, 10, 30, 90) in order to generate graphs for 1day, 10days, 30days, ... In that way we have an "MRTG-like" monitoring for our Netapp operations per second.
An other new thing is the values we get from SNMP : for CIFS for ex. we get TOTAL operations since the Filer has rebooted. This explains why we stock a "COUNTER" in RRD and not a GAUGE like usually !
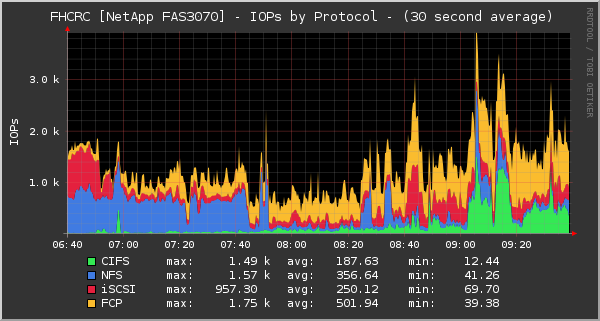
We also use Areas into RRD graphs and stack them to have a nice graph like the one on RRD's site, here

As usual, refer to the post image in order to have a preview of the graph !

Have fun !

Nov 18, 2009

RRD Monitoring tool for Disk usage


Last of my post was presenting a BASH script which monitored the usage of a FlexLM license server.
Here is how to monitor disk usage of some users' personal folders. For that we will use 2 scripts.
These are the crontab entries :


0 0 * * * /root/scripts/taille_utilisateurs
0 20 * * * /root/scripts/creation_graphs


I run the second script 20mn after the first one; it's function of the time that the first script will take to run. I recommend the first time you run the "taille_utilisateurs" script to "time" it and be sure to schedule the second one AFTER all the "du -s" of all folders is done.

Here is the first script "taille_utilisateurs" :
#!/bin/bash

stockage="/backup/vol2/rrd"
users_windows="/backup/vol1/home"
users_unix="/backup/vol2/users"
rep_logs="/root/logs"

creation_graphs(){
for i in `ls $1`
do
user=$(echo $i | sed -e 's/\.old*//')
user=$(echo $user | sed -e 's/\.//')
if [ ! -f $stockage/$2/taille_$user.rrd ]
then
rrdtool create $stockage/$2/taille_$user.rrd -s 86400 -b 1157782169 \
DS:$user:GAUGE:100000:U:U \
RRA:AVERAGE:0.5:1:150
echo "Creation du RRD "$stockage/$2/taille_$user.rrd >> $logfile
fi
done
}

maj_rrd(){
for i in `ls $1`
do
# On calcule la taille du repertoire, puis on met a jour le RRD correspondant avec la valeur
user=$(echo $i | sed -e 's/\.old*//')
user=$(echo $user | sed -e 's/\.//')
taille=$(du -sb $1/$i | awk '{print $1}')
rrdtool update $stockage/$2/taille_$user.rrd N:$taille
echo "Mise a jour du RRD" $stockage/$2/taille_$user.rrd "avec la valeur " $taille "le " `date` >> $logfile
echo $taille" "$i >> $rep_logs/tailles
done

}

logfile=$rep_logs/log-`date "+%d-%m-%Y"`
touch $logfile
echo "Debut du script de calcul des tailles le" `date` > $logfile
creation_graphs $users_unix "unix"
creation_graphs $users_windows "windows"
echo "UNIX" > $rep_logs/tailles
maj_rrd $users_unix "unix"
echo "WINDOWS" >> $rep_logs/tailles
maj_rrd $users_windows "windows"


This first script creates a RRD file per user/folder (150 values stocked, 1 every 24 hours, meaning half a year archive) and then updates the value of this file. Everything is logged in a file, and the sizes of all folders are written in the $rep_logs/tailles file. This file will be used by the second script to do a "Top10" of the most disk-consuming users.

Here is the second script, "creation_graphs" :
#!/bin/bash

stockage="/backup/vol2/rrd"
users_windows="/backup/vol1/home"
users_unix="/backup/vol2/users"
rep_logs="/root/logs"
rep_img="/var/www/html/stats"

top10(){
ligne_win=$(grep -in windows /root/logs/tailles | awk -F':' '{print $1}')
#On trace le Top10 unix
echo "rrdtool graph $rep_img/top10_unix.png \\" > /tmp/graph.sh
echo "-s \"now -4 week\" -e now \\" >> /tmp/graph.sh
echo "--title=\"Top 10 des tailles disque Home UNIX\" \\" >> /tmp/graph.sh
echo "--vertical-label=Octets \\" >> /tmp/graph.sh
echo "--imgformat=PNG \\" >> /tmp/graph.sh
echo "--width=800 \\" >> /tmp/graph.sh
echo "--base=1000 \\" >> /tmp/graph.sh
echo "--height=600 \\" >> /tmp/graph.sh
echo "--interlaced \\" >> /tmp/graph.sh
rang=10
declare -ar couleurs='([0]="#FF0000" [1]="#FF6347" [2]="#FF8C00" [3]="#FF00FF" [4]="#DDA0DD" [5]="#9ACD32" [6]="#008000" [7]="#0000FF" [8]="#6A5ACD" [9]="#48D1CC")'
for i in $(head -$ligne_win /root/logs/tailles | sort -n | tail -10 | awk '{print $2}')
do
user=$i
indice=$(expr $rang - 1)
couleur=${couleurs[$indice]}
echo "DEF:$user=$stockage/unix/taille_$user.rrd:$user:AVERAGE \\" >> /tmp/graph.sh
echo "LINE1:"$user$couleur":\""$rang") Taille de $user\" \\" >> /tmp/graph.sh
echo "VDEF:"$user"_MAX="$user",MAXIMUM \\" >> /tmp/graph.sh
rang=$(expr $rang - 1)
done
. /tmp/graph.sh

#Puis le top 10 windows
echo "rrdtool graph $rep_img/top10_windows.png \\" > /tmp/graph.sh
echo "-s \"now -4 week\" -e now \\" >> /tmp/graph.sh
echo "--title=\"Top 10 des tailles disque Home WINDOWS\" \\" >> /tmp/graph.sh
echo "--vertical-label=Octets \\" >> /tmp/graph.sh
echo "--imgformat=PNG \\" >> /tmp/graph.sh
echo "--width=800 \\" >> /tmp/graph.sh
echo "--base=1000 \\" >> /tmp/graph.sh
echo "--height=600 \\" >> /tmp/graph.sh
echo "--interlaced \\" >> /tmp/graph.sh
rang=10
declare -ar couleurs='([0]="#FF0000" [1]="#FF6347" [2]="#FF8C00" [3]="#FF00FF" [4]="#DDA0DD" [5]="#9ACD32" [6]="#008000" [7]="#0000FF" [8]="#6A5ACD" [9]="#48D1CC")'
for i in $(tail -$ligne_win /root/logs/tailles | sort -n | tail -10 | awk '{print $2}')
do
user=$i
indice=$(expr $rang - 1)
couleur=${couleurs[$indice]}
echo "DEF:$user=$stockage/windows/taille_$user.rrd:$user:AVERAGE \\" >> /tmp/graph.sh
echo "LINE1:"$user$couleur":\""$rang") Taille de $user\" \\" >> /tmp/graph.sh
echo "VDEF:"$user"_MAX="$user",MAXIMUM \\" >> /tmp/graph.sh
rang=$(expr $rang - 1)
done
. /tmp/graph.sh
}

top10


This second script generates a RRD graph corresponding to the Top10 most disk-consuming users.
In order to do this TOP10, we parse the $rep_logs/tailles file.
It's up to you to adapt this to do TOP10-20 TOP20-30 and so on.

As usual, an image of the final RRD graph is at the beginning of this post.

Have fun !

RRD Monitoring tool for FlexLM


These are some BASH scripts which generate RRD databases for FlexLM servers.

First, here is the crontab entry :
*/5 * * * * /root/scripts/ansys_lic


Here is the script ansys_lic (which monitors every 5mn the status of a FlexLM server) :
#!/bin/bash

lmutil="/usr/local/flexlm/lmutil"
license="27000@192.168.100.100"
stockage="/data/rrd"
rep_logs="/root/logs"
rep_img="/data/www/monitoring"
declare -ar features='([0]="abaqus" [1]="cae" [2]="viewer" [3]="standard" [4]="explicit" [5]="foundation" )'
declare -ar features_aff='([0]="abaqus" [1]="cae" [2]="viewer" )'
declare -ar couleurs='([0]="#FF0000" [1]="#00D832" [2]="#1C05EA" [3]="#B505EA" [4]="#DDA0DD" [5]="#9ACD32" [6]="#008000" [7]="#0000FF" [8]="#6A5ACD" [9]="#48D1CC")'
declare -ar durees='([0]="1" [1]="10" [2]="30" [3]="90" )'

creation_rrd(){

if [ ! -f $stockage/abaqus_lic.rrd ]
then
echo "rrdtool create $stockage/abaqus_lic.rrd -s 300 \\" > /tmp/create.sh
for i in ${features[*]}
do
echo "DS:$i:GAUGE:600:U:U \\" >> /tmp/create.sh
echo "RRA:MAX:0.5:1:2880 \\" >> /tmp/create.sh
echo "RRA:AVERAGE:0.5:12:480 \\" >> /tmp/create.sh
echo "RRA:AVERAGE:0.5:60:240 \\" >> /tmp/create.sh
done
echo >> /tmp/create.sh
. /tmp/create.sh
rm -f /tmp/create.sh
fi
}

maj_rrd(){
$lmutil lmstat -a -c $license > /tmp/abaqus_lic.log
commande="rrdtool update $stockage/abaqus_lic.rrd N"
for i in ${features[*]}
do
used=$(grep $i /tmp/abaqus_lic.log | grep Total |head -1| awk '{print $11}')
commande=$commande":$used"
done
$($commande)
}

creation_graph(){
for d in ${durees[*]}
do
echo "rrdtool graph $rep_img/abaqus_lic_"$d".png \\" > /tmp/graph_abaqus.sh
echo "-s \"now -"$d" day\" -e now \\" >> /tmp/graph_abaqus.sh
echo "--title=\"Occupation du serveur de licences Abaqus, "$i" derniers jours\" \\" >> /tmp/graph_abaqus.sh
echo "--vertical-label=Nombre \\" >> /tmp/graph_abaqus.sh
echo "--imgformat=PNG \\" >> /tmp/graph_abaqus.sh
echo "--color=BACK#CCCCCC \\" >> /tmp/graph_abaqus.sh
echo "--color=CANVAS#343434 \\" >> /tmp/graph_abaqus.sh
echo "--color=SHADEB#9999CC \\" >> /tmp/graph_abaqus.sh
echo "--width=800 \\" >> /tmp/graph_abaqus.sh
echo "--base=1000 \\" >> /tmp/graph_abaqus.sh
echo "--height=600 \\" >> /tmp/graph_abaqus.sh
echo "--interlaced \\" >> /tmp/graph_abaqus.sh
echo "--upper-limit=36 \\" >> /tmp/graph_abaqus.sh
echo "AREA:32#F6FACF:\"32 Licences Max\" \\" >> /tmp/graph_abaqus.sh
rang=0
for i in ${features_aff[*]}
do
couleur=${couleurs[$rang]}
echo "DEF:$i=$stockage/abaqus_lic.rrd:$i:MAX \\" >> /tmp/graph_abaqus.sh
echo "LINE1:"$i$couleur":\" Nombre de $i\" \\" >> /tmp/graph_abaqus.sh
#echo "VDEF:"$i"_MAX="$i",MAXIMUM \\" >> /tmp/graph.sh
rang=$( expr $rang + 1 )
done
. /tmp/graph_abaqus.sh
rm -f /tmp/graph_abaqus.sh
done
}

creation_rrd
maj_rrd
creation_graph

In this script you will have to change paths to FlexLM lmutil command and the features declared in the beginning.
Then you can also change the colors of the lines for representing the features (couleurs array) and the durations for graph generation (1 days, 10 days, 30 days and 90 days, durees array).

3 things are done in the script : first we create the RRD database (5mn between 2 records, and we keep 2880 records of these, meaning the last 10 days with precision of 5mn, then we keep 480 records of the max every 60mn, meaning 20 days, at last we keep 240 records of the max every 5hours, meaning 50 days). It's up to you to change this.
After creating the database we update the values in the RRD file, and the we re-generate the png graphic.

The final result is the image in the beginning of the post; it's the last day graph for license usage.

Have fun !